 Intranet
 Access
 Contact


The research unit “RNA Architecture and Reactivity” gives you access to free scientific software:
Made by Fabrice Jossinet
Made by Ludmila Urzhumtseva and Alexandre Urzhumtsev
The purpose of the program
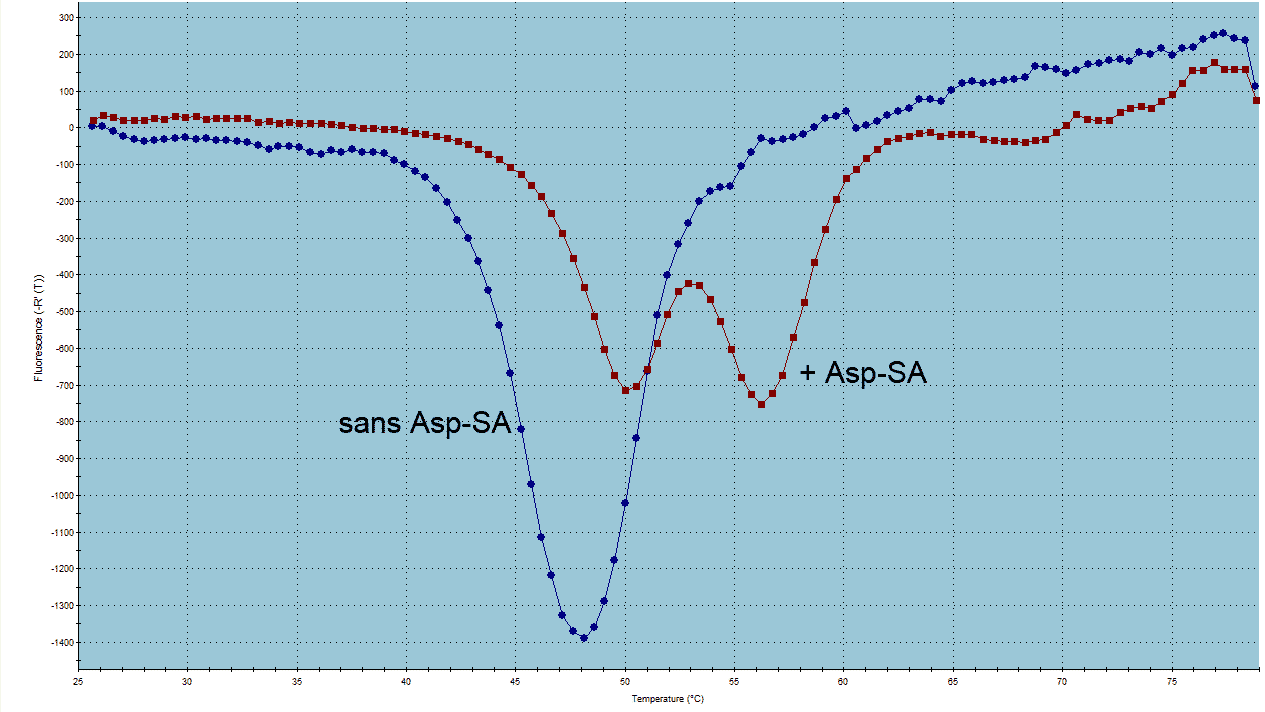
The program compares two crystallographic or cryoEM maps (Fourier syntheses) calculated in the same set of the grid nodes. The metrics used by the program are inspired by a visual comparison of two such maps. For comparison, each grid node is characterized by its quantile rank which is an intrinsic characteristic of an isosurface and which does not change with any monotonous scaling, linear or not. The calculated discrepancy function shows the normalized difference between the regions chosen in these maps applying the same quantile rank cut-off. The peak correlations show the similarity of the peaks, also scaled in the quantile ranks, inside these selected regions.
Computer requirements for the software
The basic version of the program was developed for Windows and also runs on Linux and Mac OS.
The program can be run using the independently installed Python (from version 2.6), wxPython and Numpy libraries.
When the PHENIX GUI is installed, the program can also be run by typing the command COMPaRS.py
No installation is required after downloading COMPaRS.py.
Download
- source file in wxPython: COMPaRS.py
- Example files : if2_53_m41_2A.xplor and if2_53_m53_2A.xplor
- readme file: COMPaRS_readme.pdf
Made by Ludmila Urzhumtseva and Alexandre Urzhumtsev
The purpose of the program
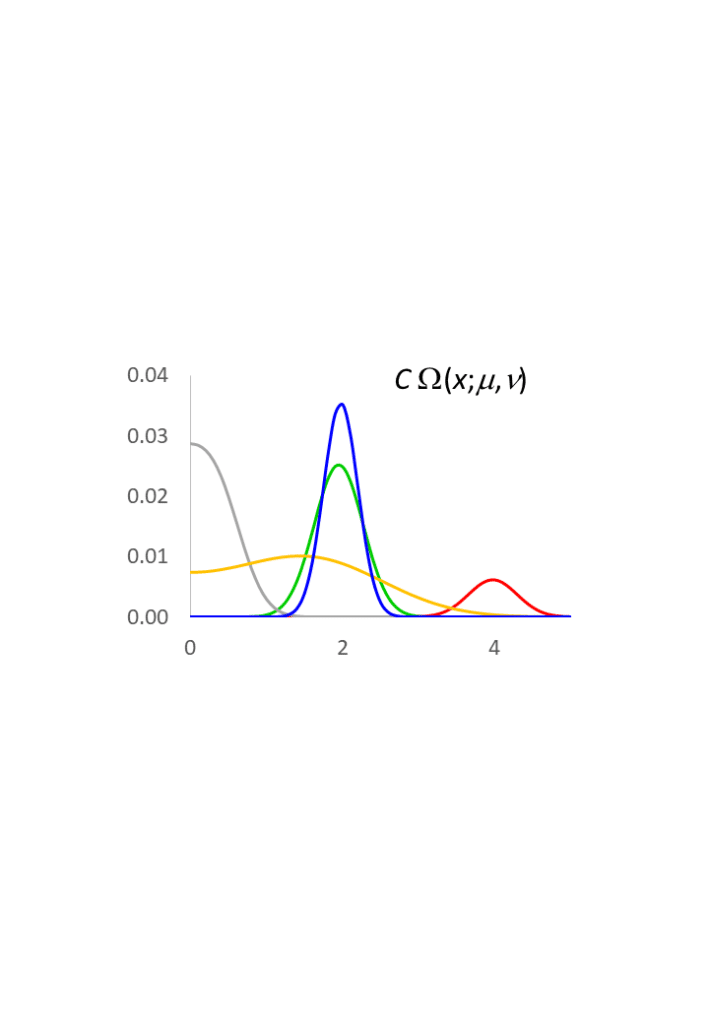
The suite dec3D has been developed to decompose spherically symmetric functions in three-dimensional space into a sum of terms of a special form, each reproducing a shell solitary wave (Urzhumtsev & Lunin; BioRxiv, https://doi.org/10.1101/2022.03.28.486044 ). An example of such functions is atomic images at a limited resolution, with a peak in the origin surrounded by Fourier ripples. The terms are expressed through a specially designed function W(r;m,n). One of its properties is that, once decomposed, an atomic image can be then calculated with any value of the displacement parameter (ADP) and at any resolution by a simple modification of the parameter values m and n. Algorithms and programs are described in Urzhumtseva et al., http://arxiv.org/abs/2206.08935
Computer requirements for the software
The software has been developed under Windows.
The fortran version (4 programs) has been compilied with g77. The python version (4 programs + GUI script) was developed in Python3 (Python 3.7.4 and higher) using numpy (1.18.4 and higher) and scipy (1.6.3 or higher).
The GUI version requires additionally wxPython (4.0.6 or higher) and matplotlib (3.4.3 or higher) ; it is independent of other individual programs of the package.
The programs may be compatible with some earlier versions of python and its libraries.
For the fortran version, simply compile dec3D-atom and dec3D-sum and run respective make-files to generate exe files of dec3D and dec3D-sumr.
The commands to run the command line versions are:
- dec3D***.exe
- dec3D***.py
where *** is ignored for the main program and is -atom, -sum, -sumr for other programs.
Each *.dat file contains the full list of parameters, many of them being optional and can be removed.
Download
- dec3D_fortran.zip – fortran version of software, including two make-files
- dec3D_py.zip – python3 version
- dec3D_data.zip – examples of data files, identical for both versions
- dec3D_results.zip – some examples of files generated by the software
- dec3D_GUI.zip – files for the interactive version of the software
Made by Ludmila Urzhumtseva and Alexandre Urzhumtsev
Urzhumtseva, L., Urzhumtsev, A. (2008) “Program CRYC3D for geometric computing in crystallography : teaching and applications”. J. Appl.Cryst., 41, 479-480
The purpose of the program
The crystallographic calculator works with various 3D objects (or lists of theis) expressed in Cartesian or crystallographic coordinates (fractions) or defined in the reciprocal space.
System requirements
The program requires that your computer has the standard Tcl/tk libraries (Windows, Linux, MacOSX). If not, they are available for free on a number of sites, for example
- http://www.tcl.tk/software/tcltk/
- http://ankif.free.fr/info
or others and automatically installed.
To install the program, place the cryc3D_v4.tcl file in any directory on your computer.
IMPORTANT: The first line of the cryc3D_v4.tcl file should show the correct path to the “wish” command in the Tcl/tk libraries – please correct if this is not the case.
Download
- source file in Tcl: cryc3D_v4.tcl
- software documentation: cryc3D-demo.ppt
Made by Ludmila Urzhumtseva and Alexandre Urzhumtsev
The purpose of the program
The program defines the effective resolution of a set of reflections whatever its completeness is.
By definition, the effective resolution d_effective coincides with the highest resolution, d_high, for any complete data set and is different (usually lower) for an incomplete data set.
For anisotropic data sets both the highest and the lowest resolutions, depending on the direction, are determined. The corresponding directions are also identified.
The program defines also the minimum and maximum optical resolution with the values of the amplitudes / intensities of these reflections
Computer requirements for the software
The basic version of the program was developed for Windows while it runs also under Linux and Mac OS.
The program can be run using independently installed Python ( starting from version 3.7), wxPython and Numpy libraries.
When GUI PHENIX is installed, one can also run the program typing a command: efresol_4_1.py
No installation is required after efresol_4_1.py is downloaded.
Download
- source file in wxPython: efresol_4_1.py
- MTZ example files: data_IF2_GDP_pH65.mtz and data_IF2_APO_wt.mtz
- readme file: efresol_readme.pdf
Made by Ludmila Urzhumtseva and Alexandre Urzhumtsev
The purpose of the program :
to study the distribution of unmeasured diffraction data. Differently from usual statistics of overall data completeness, the program shows how these reflections are distributed in reciprocal space. The program identifies continuous regions of unmeasured (absent) data and displays the sphere of reciprocal space at a given resolution indicating the measured and unmeasured reflections. Unmeasured reflections can be shown all together or by the continuous regions to which they belong.
System requirements
The basic version of the program was developed for Windows while it runs also under Linux and Mac OS.
For Python 2: Python versions starting from 2.6 + wxPython library.
For Python 3: Python versions starting from 3.7 + wxPython library.
To install the program, copy the files fobscom2_1.py (version Python 2) or fobscom_6_5.py (Python 3 version) and fam.itc in any directory.
Download:
- Source files in wxPython: fobscom_2_1.py, fobscom_6_5.py
- Spatial group database (not required for the Python3 version): fam.itc
- Examples: data_IF2_GDP_pH65.mtz, data_IF_APO_wt.mtz
Made by Ludmila Urzhumtseva and Alexandre Urzhumtsev
Urzhumtseva, L., Afonine, P.V., Adams, P.D., Urzhumtsev, A. (2009) “Crystallographic model quality at a glance”. Acta Cryst., D65, 297-300
The purpose of the program
Shows qualitatively if some models parameters are over- or under-refined compares the model characteristics with those for previously refined models.
The program requires that your computer has the standard Tcl/tk libraries installed (Windows, Linux, MacOSX).
To install the program, put the file polygon0612.tcl in any directory, unzip pdb_2009-04-29_ord.zip files and then look the polygon_readme_2 file.
The third file, polygon_pdb-mvd-examples.zip , contains examples of files that POLYGON can process complementary to the database
System requirements
The program requires that your computer has the standard Tcl/tk libraries installed (Windows, Linux, MacOSX).
To install the program, place the files polygon0612.tcl and pdb_2009-04-29_ord in the same directory.
IMPORTANT: The first line of the polygon0612.tcl file must show the correct path to the “wish” command in the Tcl/tk libraries – please correct if this is not the case.
Download
- source file in Tcl: polygon0612.tcl
- database: pdb_2009-04-29_ord
- software documentation: polygon_readme_2
- examples: polygon_pdb-mvd-examples
pym_convrot was created by Ludmila Urzhumtseva and Alexander Urzhumtsev
The purpose of the program
The programme has a double purpose:
- Conversion of rotation parameters from one convention to another
- Teaching of various conventions of rotation parameters
The program is a natural methodologic suite of the program ‘convrot’ while technically it is fully original and written in python. All possible conventions of Euler and polar angles can be used, as well as those in terms of direction cosines and in terms of rotation matrices. Interactive demos for input / output conventions help to understand features of these conventions, their differences and common aspects. The presence of symmetry operations and different choice of the unit cell orthogonalisation can be taken into account. For a list of atoms, defined as a PDB or PDBx/mmCIF file, the program can directly recalculate their coordinates accordingly to the transformation obtained (rotation + translation).

System requirements
The basic version of the programme has been developed for Windows, but it also works under Linux and Mac OS.
The program can be run using independently installed Python (versions 2.6 – 2.7 and 3.7 – 3.8), with the wxPython library. When GUI PHENIX is installed, one can also run the program typing a command: pym2_convrot_270820.py or pym3_convrot_270820.py.
Download (source file in wxPython + help files in .pdf: pym2_convrot.zip or pym3_convrot.zip )
Made by Urzhumtseva L.M., Barchet, C., Klaholz B.P. and Urzhumtsev A.G.
Publication : Urzhumtseva et al. (2024) J.Appl.Cryst, v. 57; doi.org/10.1107/S1600576724002383
The purpose of the program
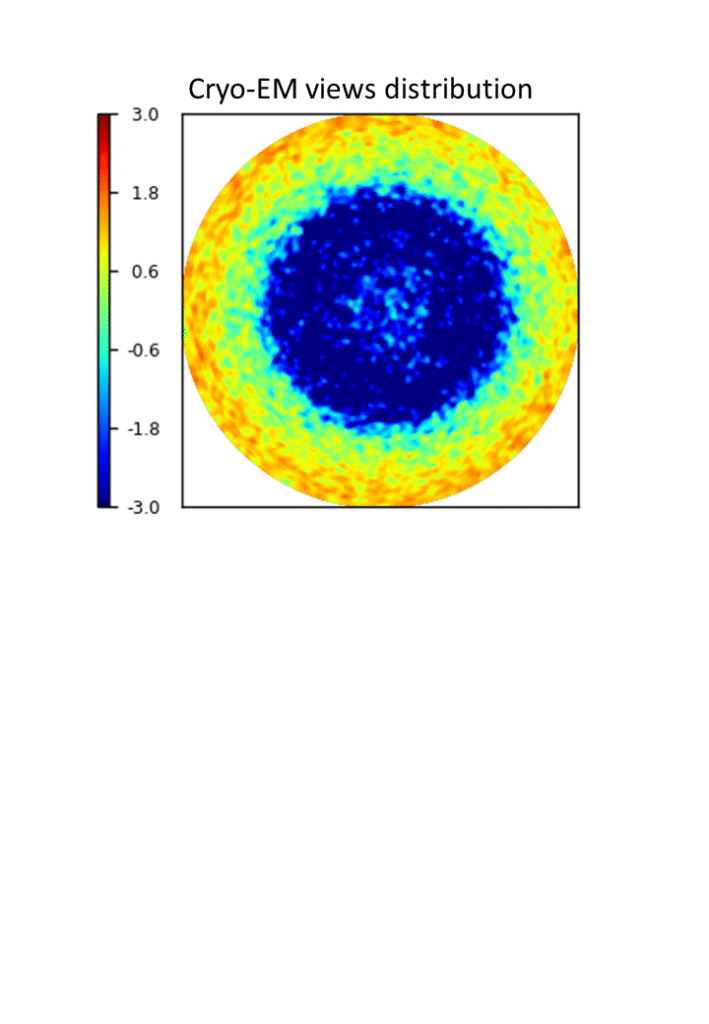
The program VUE represents the distribution of cryo-EM views (projections) to be used for the 3D image reconstruction and performs a basic statistical analysis of this distribution. The views are represented by dots, eventually of a different color for different frequencies, and by a frequency distribution map calculated on a uniform grid on a spherical surface. Both are given in the Lambert projection which conserves the surface area of the spherical elements; therefore, these images represent the distribution correctly not only qualitatively but also quantitatively. The histogram and respective cumulative histogram show, in a logarithmic scale, the number of uniform grid cells as a function of the associated views frequency. If required, the program can create an output file, in the same format as the input one, completing each line by the frequency of the respective view and by a weight to be used during image reconstruction to equilibrate eventually uneven distributions.
System requirements
The program uses the standard python3 (version 3.7.4 was used to develop the program) with its libraries Numpy (version 1.18.4 or higher) and MatPlotLib (version 3.4.3 or higher), while it may work with some older versions as well (not tested).
Download
- VUE_x.py – program script on python3 (latest version)
- run_ct24_data.star – example of the file of views in star format
- VUE_24.dat – example of the input file of parameters to analyze run_ct24_data.star (rename to VUE.dat to run example)
- VUE_24.log – respective log-file after program run with VUE_24.dat
- Figure_24.png – respective image produced by the program with VUE_24.dat
- un_ct24_dataw.star – file of views created by VUE run with VUE_24.dat
- VUE_24w.dat – example of the input file of parameters to analyze run_ct24_dataw.star (rename to VUE.dat to run example)
- VUE_24w.log – respective log-file after program run with VUE_24w.dat
- Figure_24w.png – respective image produced by the program with VUE_24w.dat
- VUE_example.dat – a data file with the full list of parameters, their short-cuts, allowed and default values and comments